|
|
- Info
Statistiques 3ième trimestre 2008
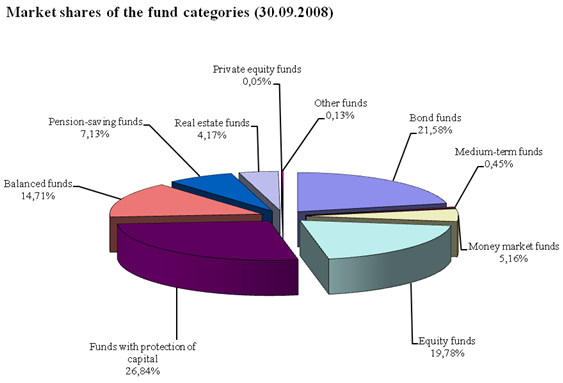
Actif net des OPC belges et étrangers diffusés en Belgique par type d'investissement
| 30/06/2008 | 30/09/2008 | Change |
| bil. EUR | % | bil. EUR | % | bil. EUR | % | | Bond funds | 32,07 | 21,76% | 29,31 | 21,58% | -2,76 | -8,61% | | without fixed term | in EUR | 14,48 | 9,83% | 13,34 | 9,82% | -1,15 | -7,92% |
| in other currencies | 15,38 | 10,44% | 13,72 | 10,10% | -1,66 | -10,77% | | with fixed term | in EUR | 1,93 | 1,31% | 1,98 | 1,46% | 0,04 | 2,18% |
| in other currencies | 0,27 | 0,18% | 0,27 | 0,20% | 0,00 | 0,49% | | Medium-term funds | 0,69 | 0,47% | 0,62 | 0,45% | -0,08 | -10,91% |
| in EUR | 0,58 | 0,39% | 0,51 | 0,37% | -0,07 | -12,21% |
| in other currencies | 0,11 | 0,08% | 0,11 | 0,08% | -0,00 | -4,18% | | Money market funds | 6,85 | 4,65% | 7,01 | 5,16% | 0,15 | 2,25% |
| in EUR | 6,26 | 4,25% | 6,46 | 4,76% | 0,20 | 3,22% |
| in other currencies | 0,59 | 0,40% | 0,54 | 0,40% | -0,05 | -8,05% | | Equity funds | 31,74 | 21,54% | 26,86 | 19,78% | -4,88 | -15,36% |
| Belgium | 2,02 | 1,37% | 1,63 | 1,20% | -0,39 | -19,38% |
| Euroland | 5,47 | 3,71% | 4,82 | 3,55% | -0,65 | -11,90% |
| Europe | 11,01 | 7,47% | 8,39 | 6,18% | -2,62 | -23,77% |
| America | 2,43 | 1,65% | 2,19 | 1,61% | -0,25 | -10,24% |
| Asia | 2,19 | 1,49% | 1,86 | 1,37% | -0,33 | -15,06% |
| other | 8,61 | 5,85% | 7,98 | 5,87% | -0,64 | -7,40% | | Funds with capital protection | 37,87 | 25,70% | 36,46 | 26,84% | -1,40 | -3,71% | | 1. linked to equity | 28,94 | 19,64% | 27,51 | 20,25% | -1,43 | -4,94% |
| Belgium | 0,41 | 0,28% | 0,43 | 0,32% | 0,02 | 5,74% |
| Euroland | 3,99 | 2,71% | 3,52 | 2,59% | -0,47 | -11,84% |
| Europe | 2,15 | 1,46% | 1,99 | 1,46% | -0,16 | -7,58% |
| America | 0,26 | 0,18% | 0,28 | 0,20% | 0,01 | 5,01% |
| Asia | 0,73 | 0,49% | 0,72 | 0,53% | -0,00 | -0,11% |
| other | 21,40 | 14,52% | 20,57 | 15,14% | -0,83 | -3,88% | | 2. linked to interest rates, loans and currencies | 8,93 | 6,06% | 8,96 | 6,59% | 0,03 | 0,30% |
| in EUR | 8,00 | 5,43% | 8,00 | 5,89% | 0,00 | 0,03% |
| in other currencies | 0,93 | 0,63% | 0,95 | 0,70% | 0,02 | 2,59% | | Balanced funds | 21,74 | 14,75% | 19,99 | 14,71% | -1,75 | -8,05% | | Pension-saving funds | 10,50 | 7,13% | 9,68 | 7,13% | -0,82 | -7,78% | | Real estate funds | 5,60 | 3,80% | 5,66 | 4,17% | 0,06 | 1,15% | | Private equity funds | 0,09 | 0,06% | 0,07 | 0,05% | -0,02 | -19,64% | | Other funds | 0,21 | 0,15% | 0,18 | 0,13% | -0,03 | -16,00% | | TOTAL | | 147,36 | 100,00% | 135,84 | 100,00% | -11,52 | -7,81% | | Funds of Funds | 21,18 |
| 18,64 |
| -2,54 | -11,97% | | Securitisation funds |
| 0,43 |
| 0,40 |
| -0,03 | -6,77% |
|
